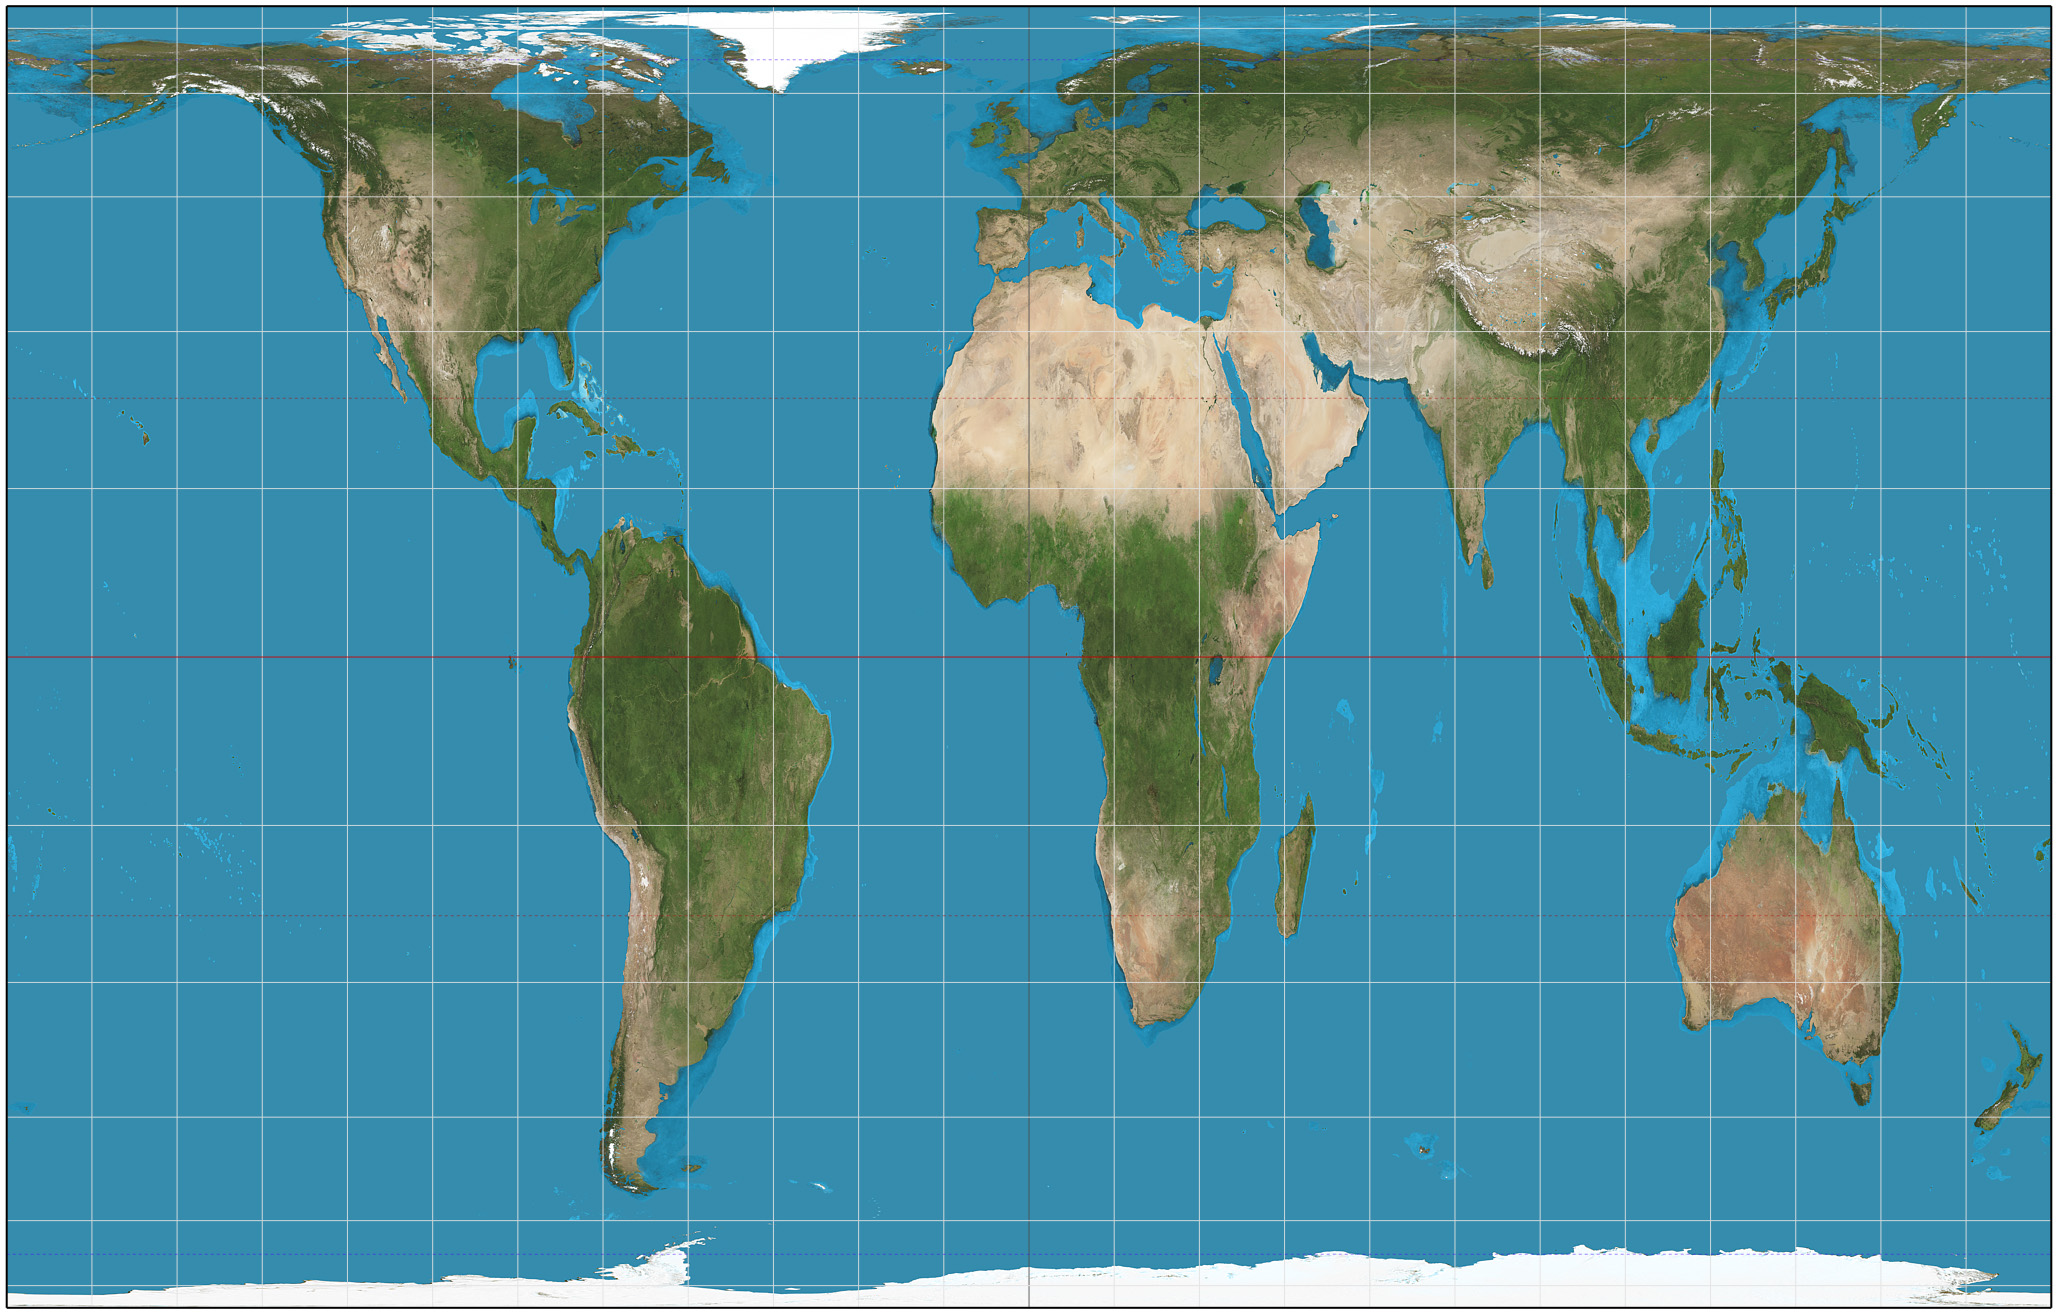
Peters projection (1973)
The Peters projection (1973), also called the Gall-Peters projection, is an equal-area projection, a way to show the round Earth as a rectangle while keeping all the areas that are equal on Earth equal on the map. It comes at the cost of making some continents and countries appear narrower than they are.
Its glory days were the 1970s and 1980s when it was beloved by the likes of UNESCO, UNICEF, Oxfam and the pope. Cartographers hated it, mainly because it was the work of an outsider.
It was invented by Arno Peters, a German historian, in 1973 – and by James Gall, a Scottish pastor, in 1855. And maybe by Marinus of Tyre too, in AD 100 or so.
Gall thought it was kind of interesting, while Peters thought it was the way, the truth and the light.
In the 1950s Peters wrote a world history book for East and West German schools. He did not like the Eurocentrism of most world histories in the West. Like how they pretty much start in the middle of history with Greece and Rome and then act like nothing much was going on in the world during the Western Dark Ages. So by design he gave equal time periods equal space.
He wanted a map to go with the book, one just as un-Eurocentric, one that gave equal areas, you know, equal areas.
Back then world maps in the West most commonly used the Mercator projection (1569). It was Eurocentric: Europe seems larger than South America while North America seems larger than Africa – when in fact both continents are much smaller than that.
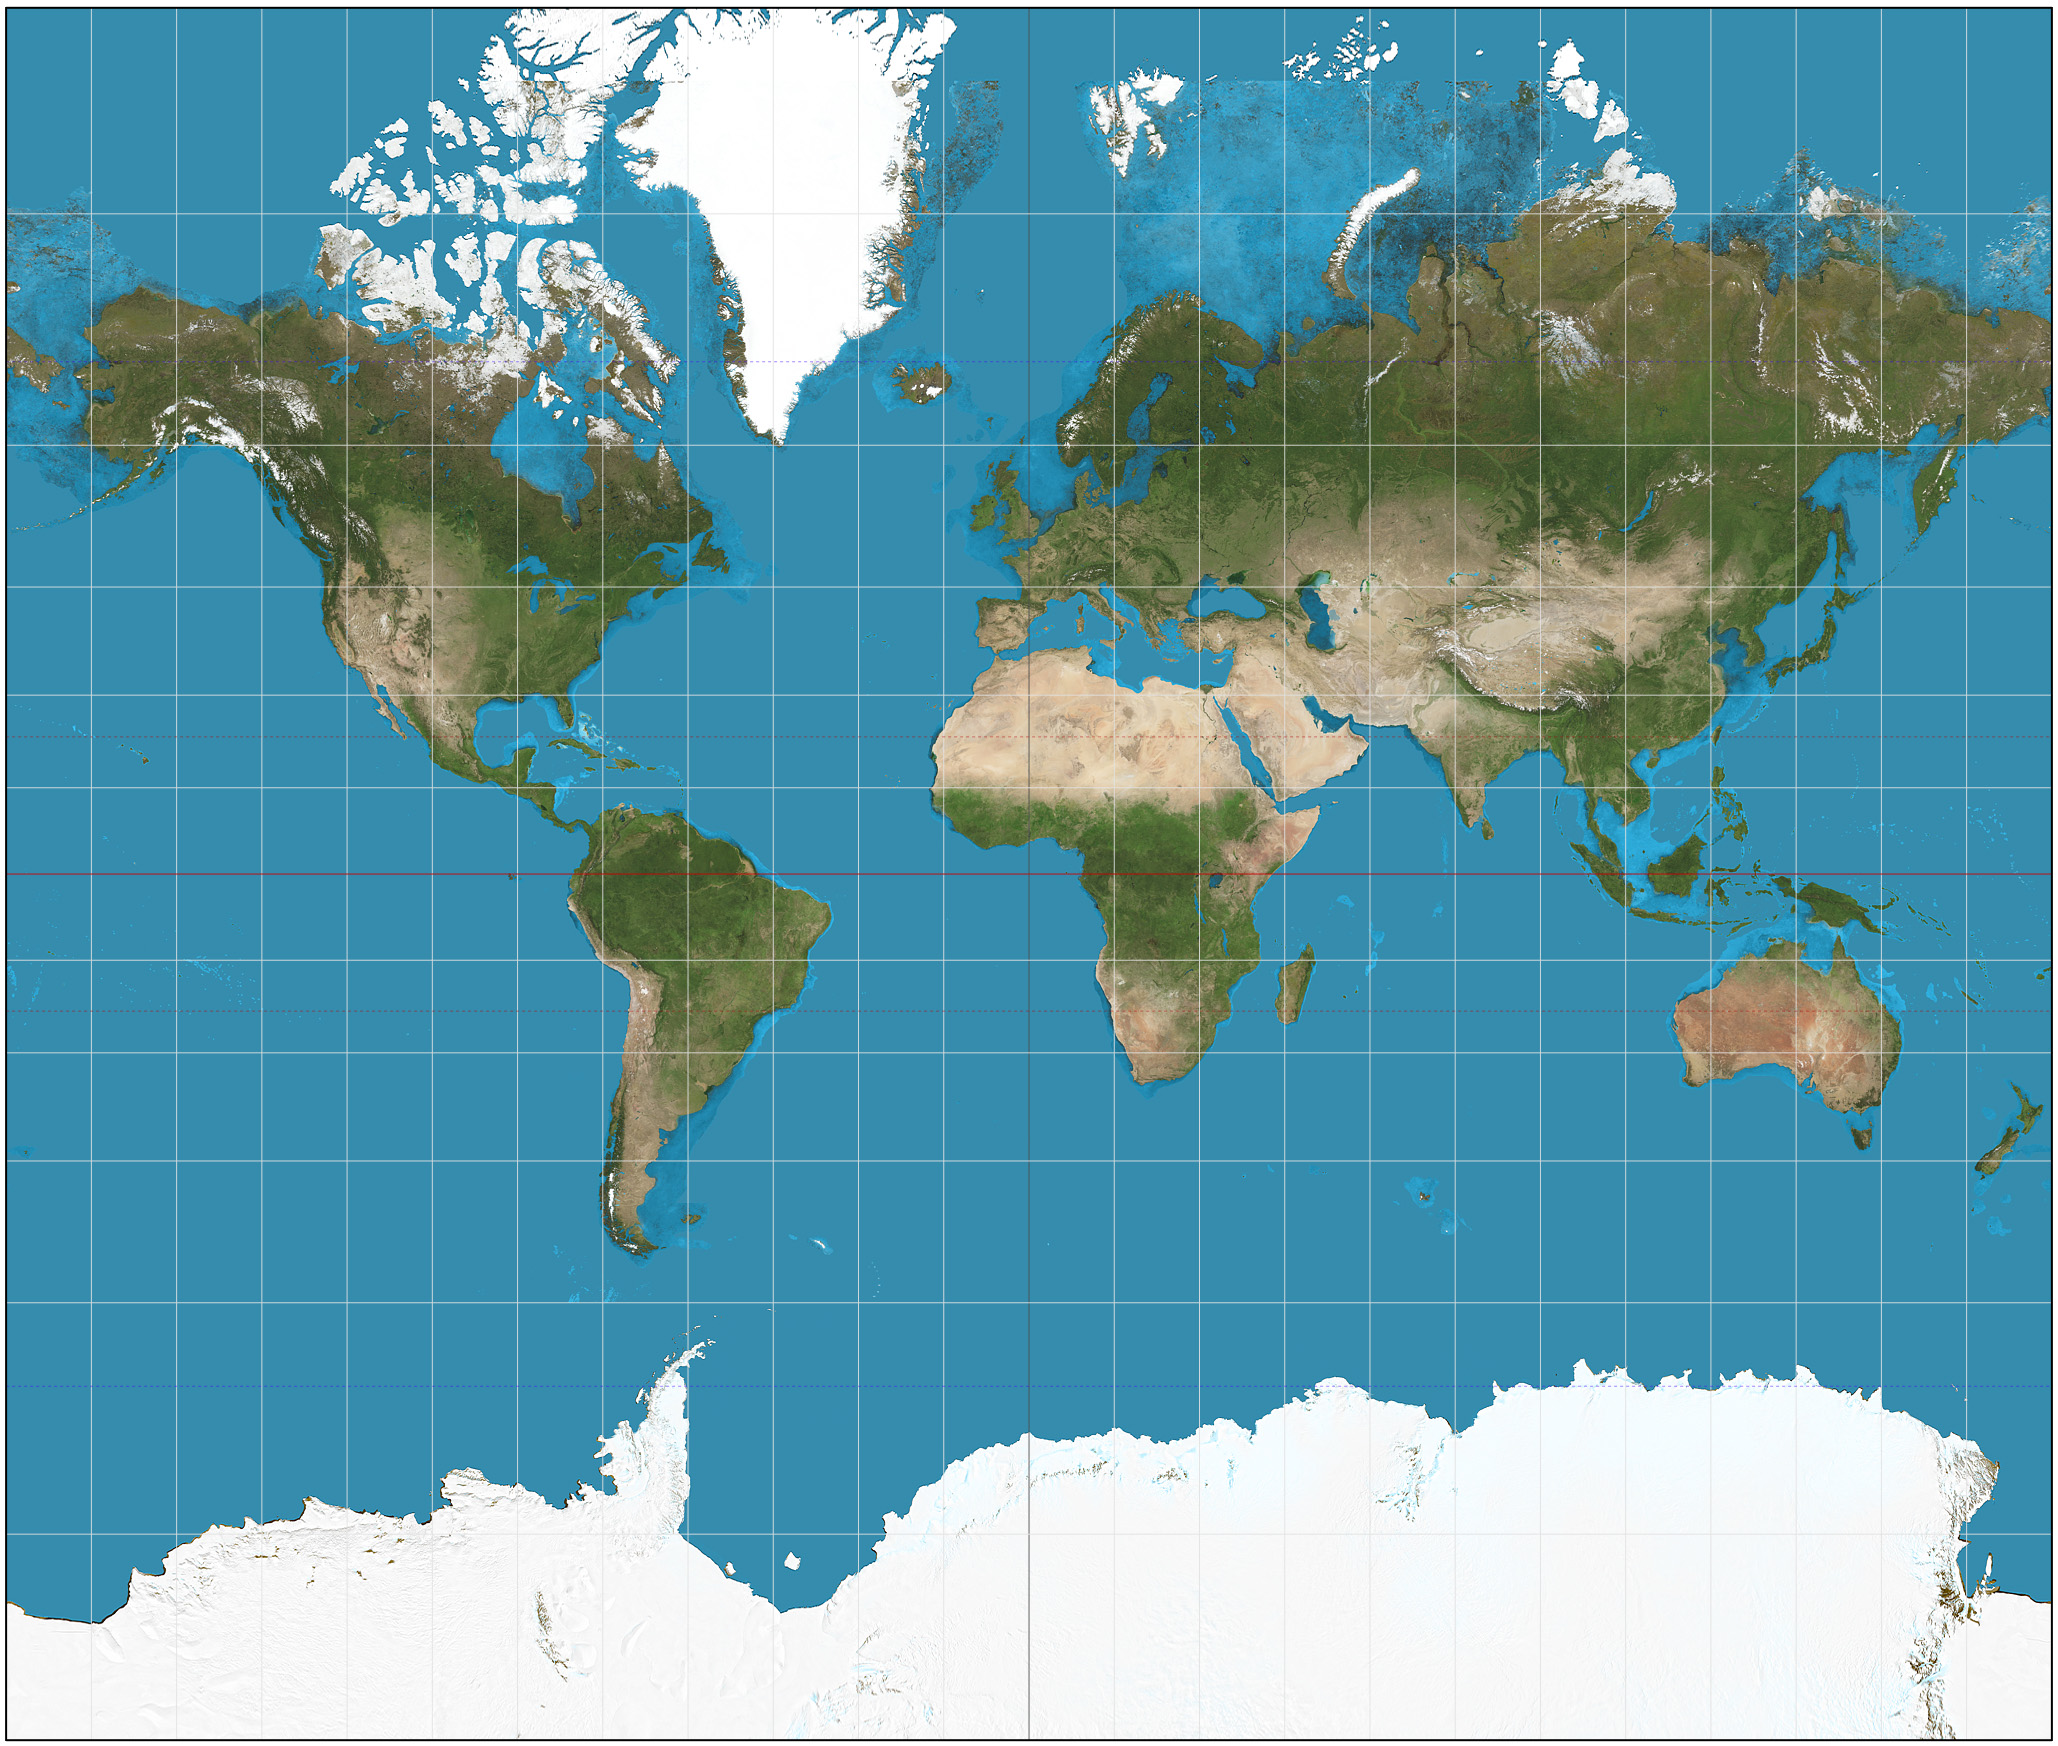
Mercator projection (1569)
Meanwhile, Rand McNally, an American map publisher, was also working on a new projection. In 1961 they asked Canadian cartographer Arthur Robinson to make one that was not too distorted and pleasing to the eye. It would become the most common projection in the West, the one National Geographic used in the 1990s:
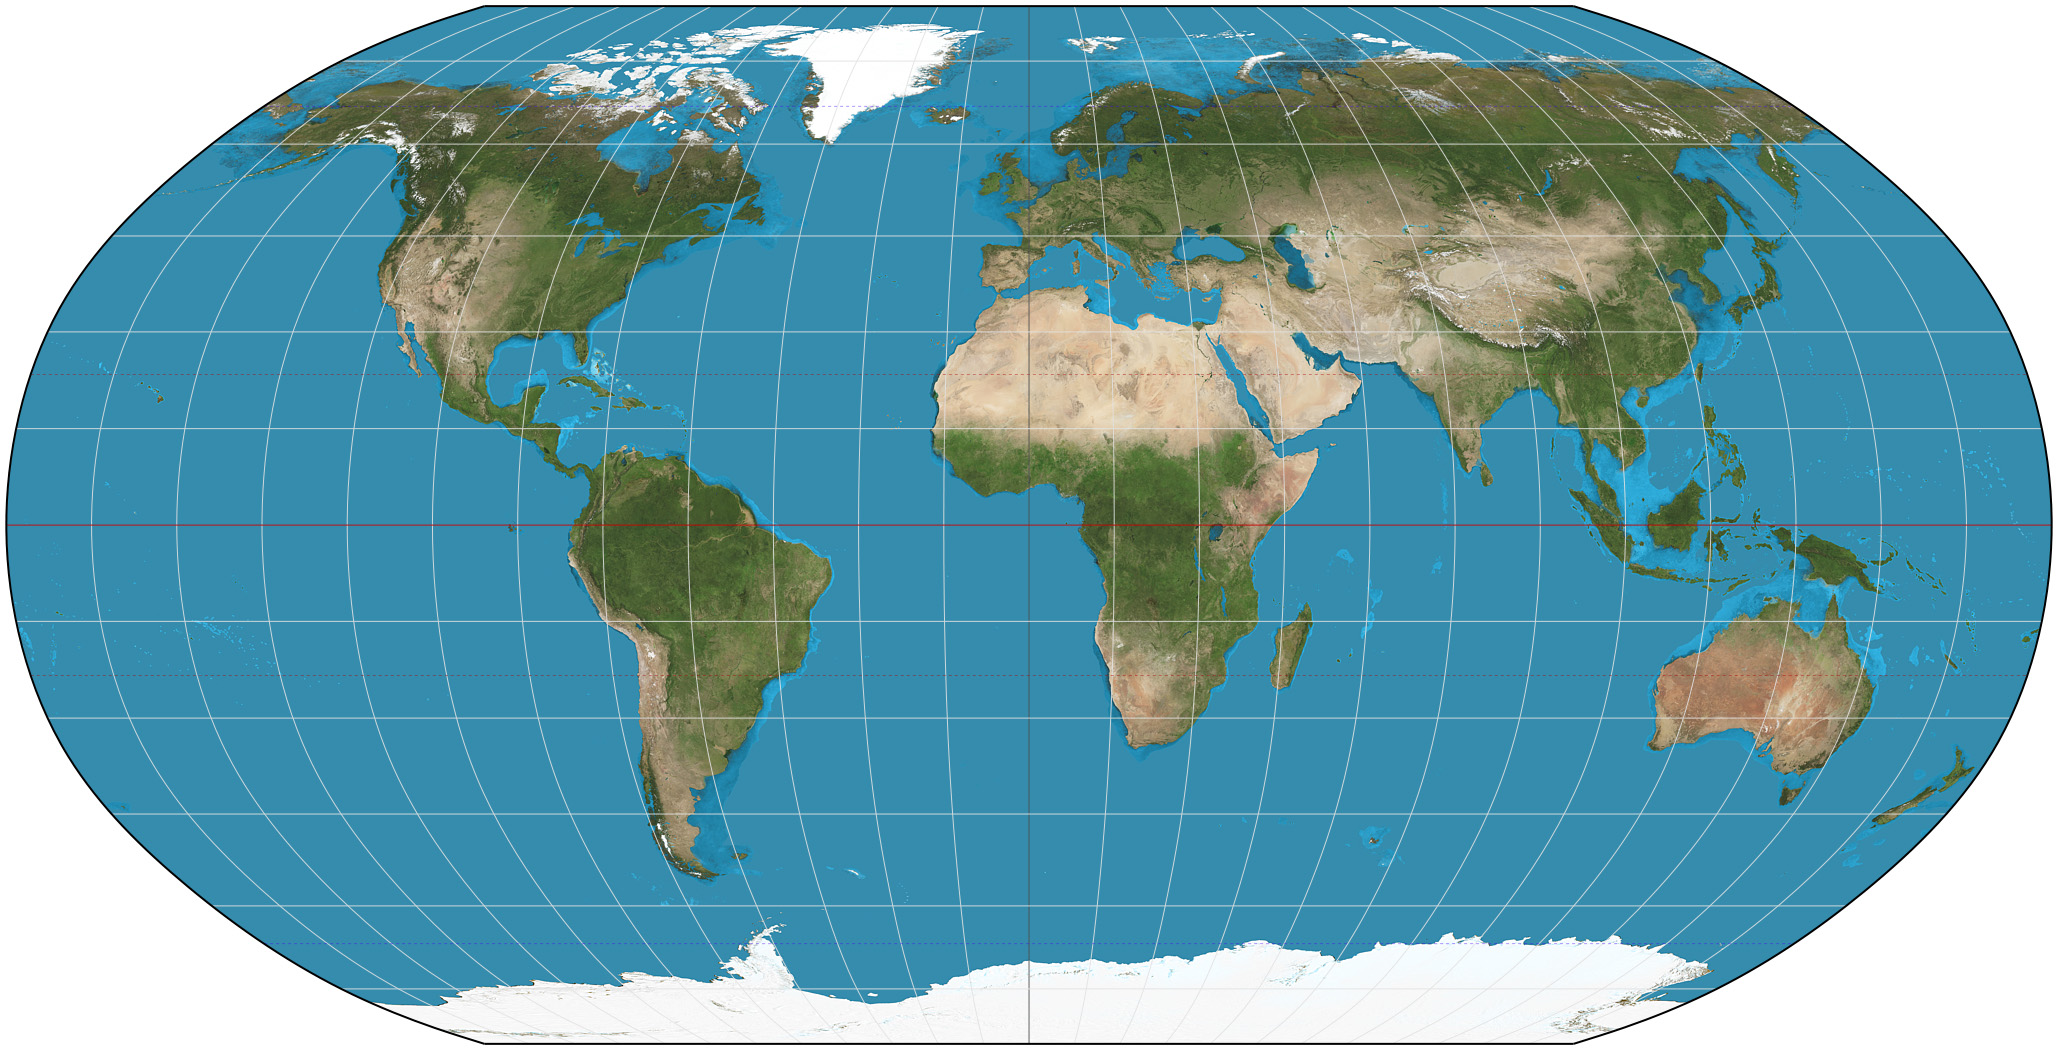
Robinson’s projection (1963)
In Robinson’s projection Europe and North America still appear bigger than they are.
Peters and Robinson each thought his own map was the most accurate, the most objective.
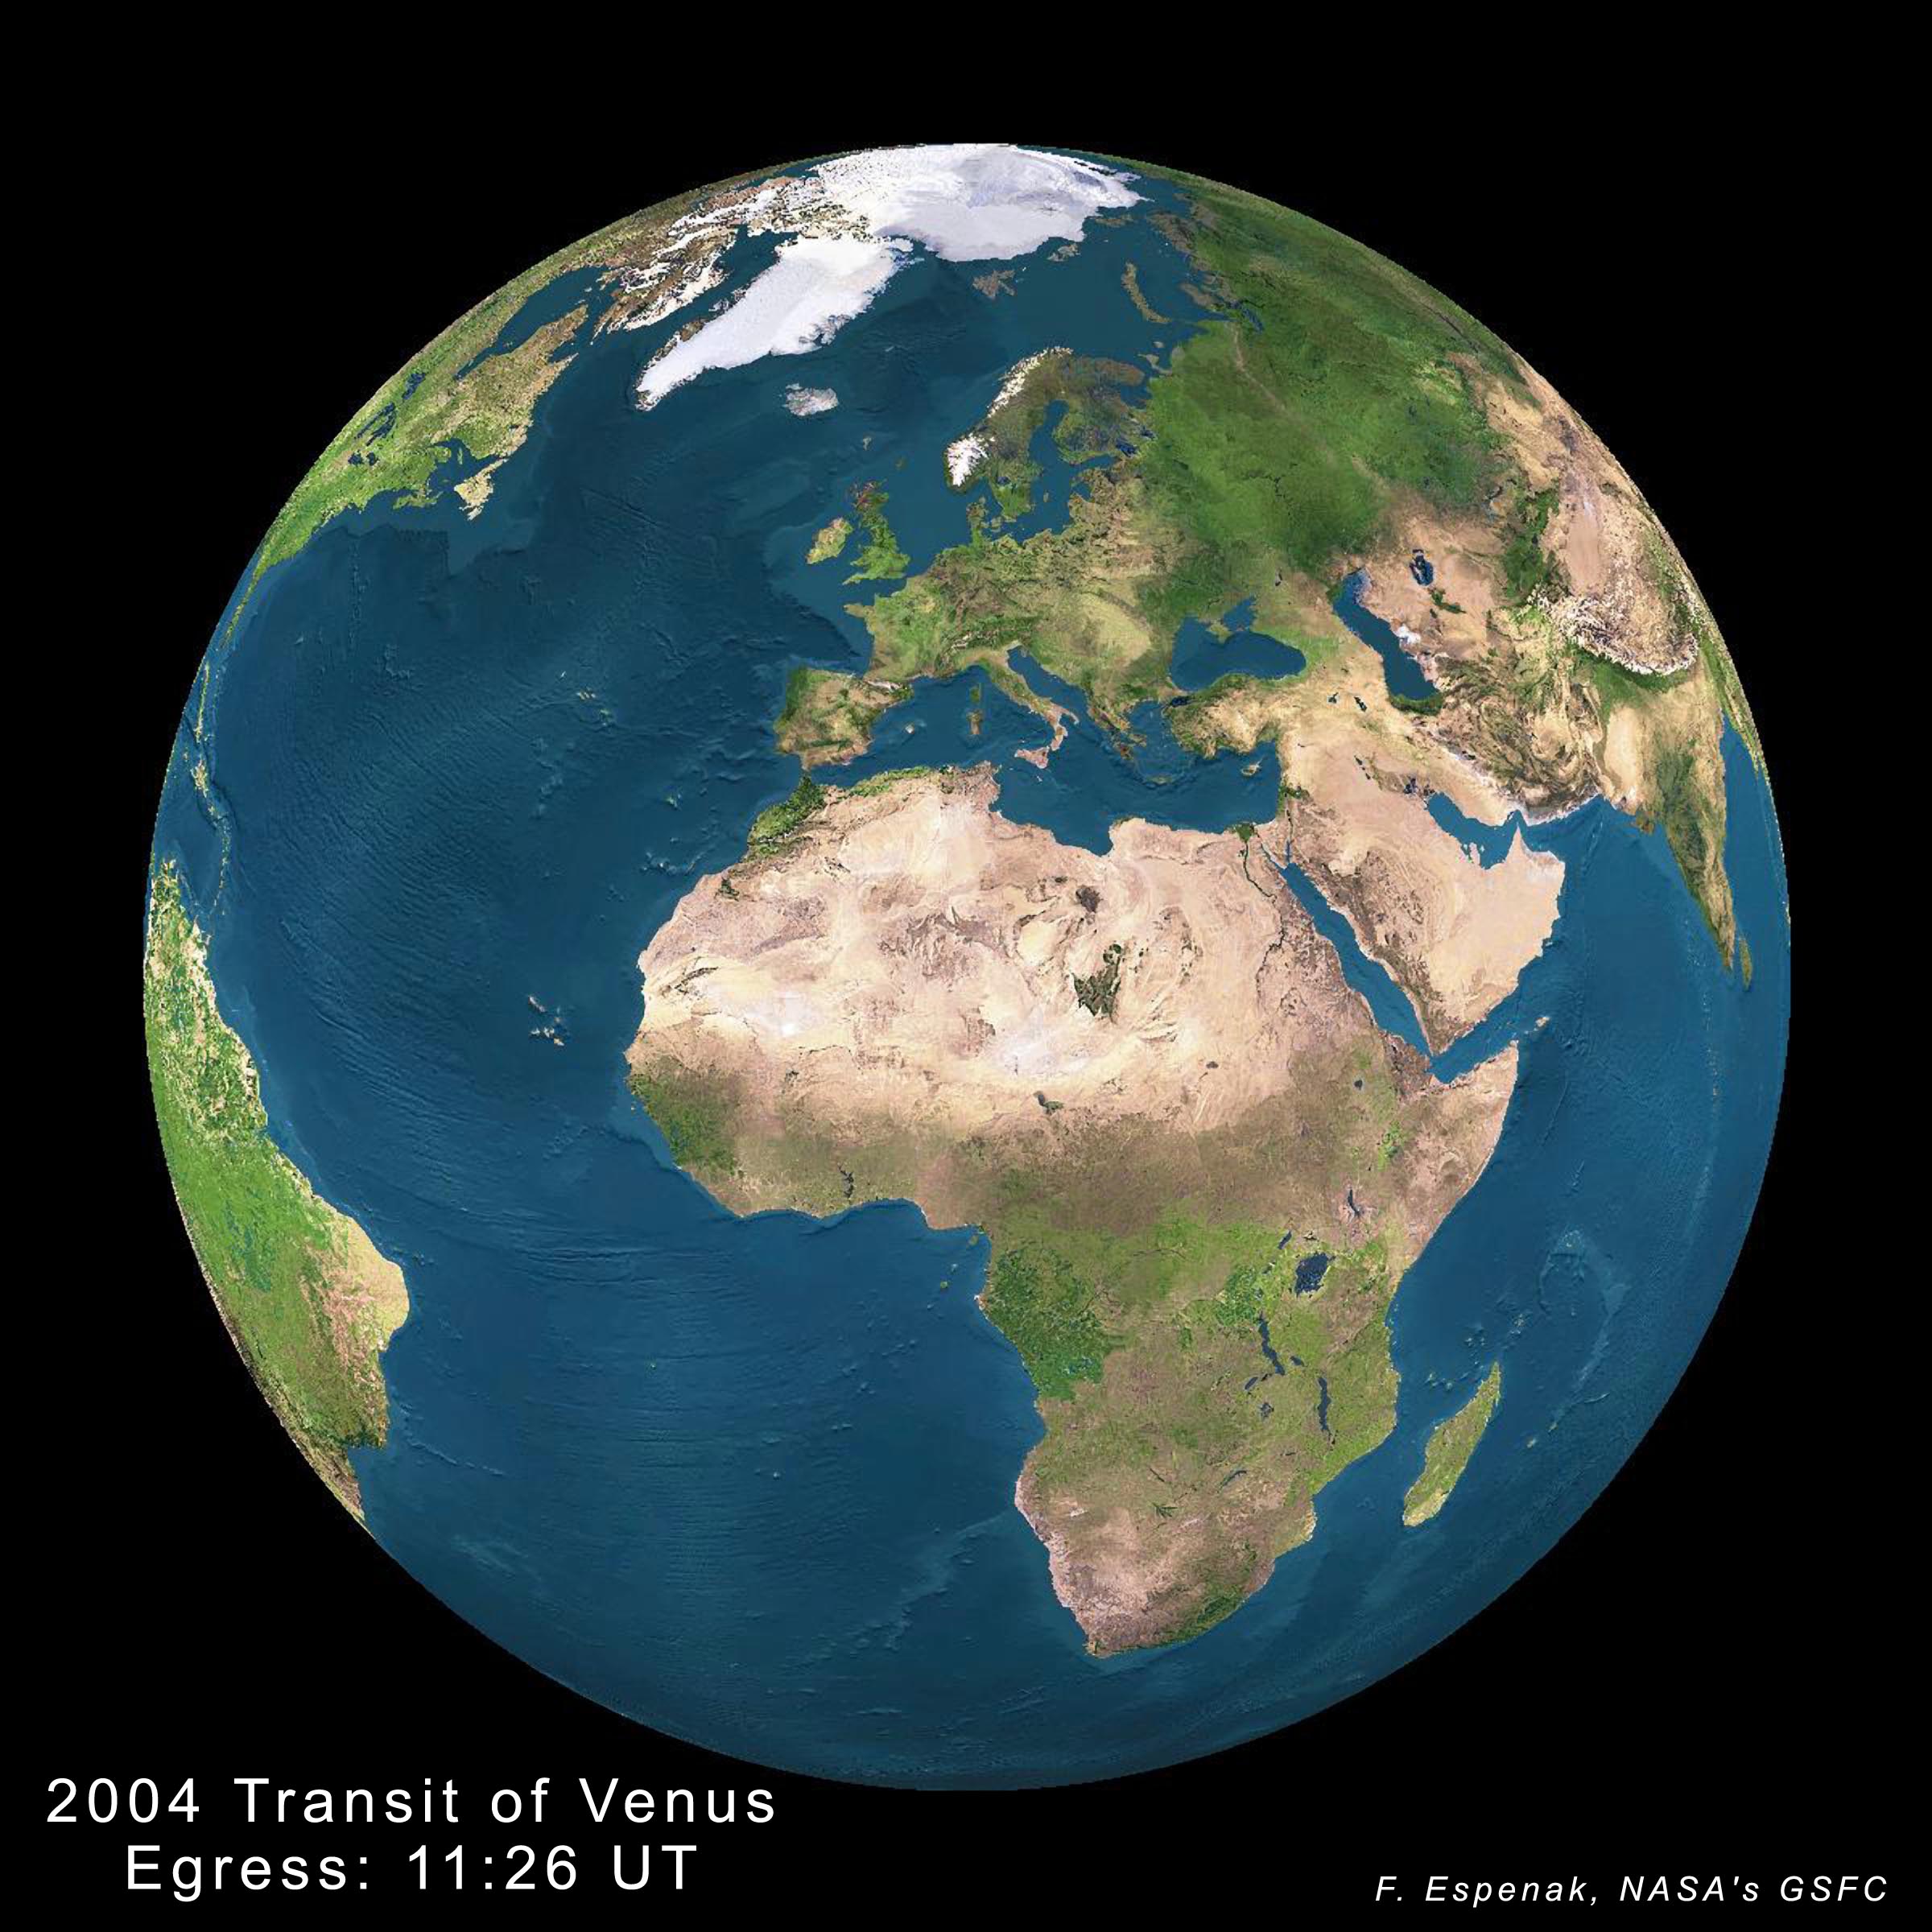
Notice how much smaller Europe is than Africa. The Earth as it would look from space if there were no clouds, no seas and the bottom of the sea was dark blue, not dark grey.
In making a flat map of a round world there will be distortions no matter what you do. You have to make trade-offs depending on the purpose of the map.
Mercator, for example, probably would not care that Greenland is freakishly huge on his map because it was not meant for schoolteachers of geography but ship captains of east-west sea trade.
What neither Peters nor Robinson seemed to understand, but which the Peters projection made plain to others, is that map-making is a political act, that every map has biases.
Even Peters himself did not completely escape his own Eurocentrism: Europe’s shape is way less distorted than Africa’s and it is still top and centre.
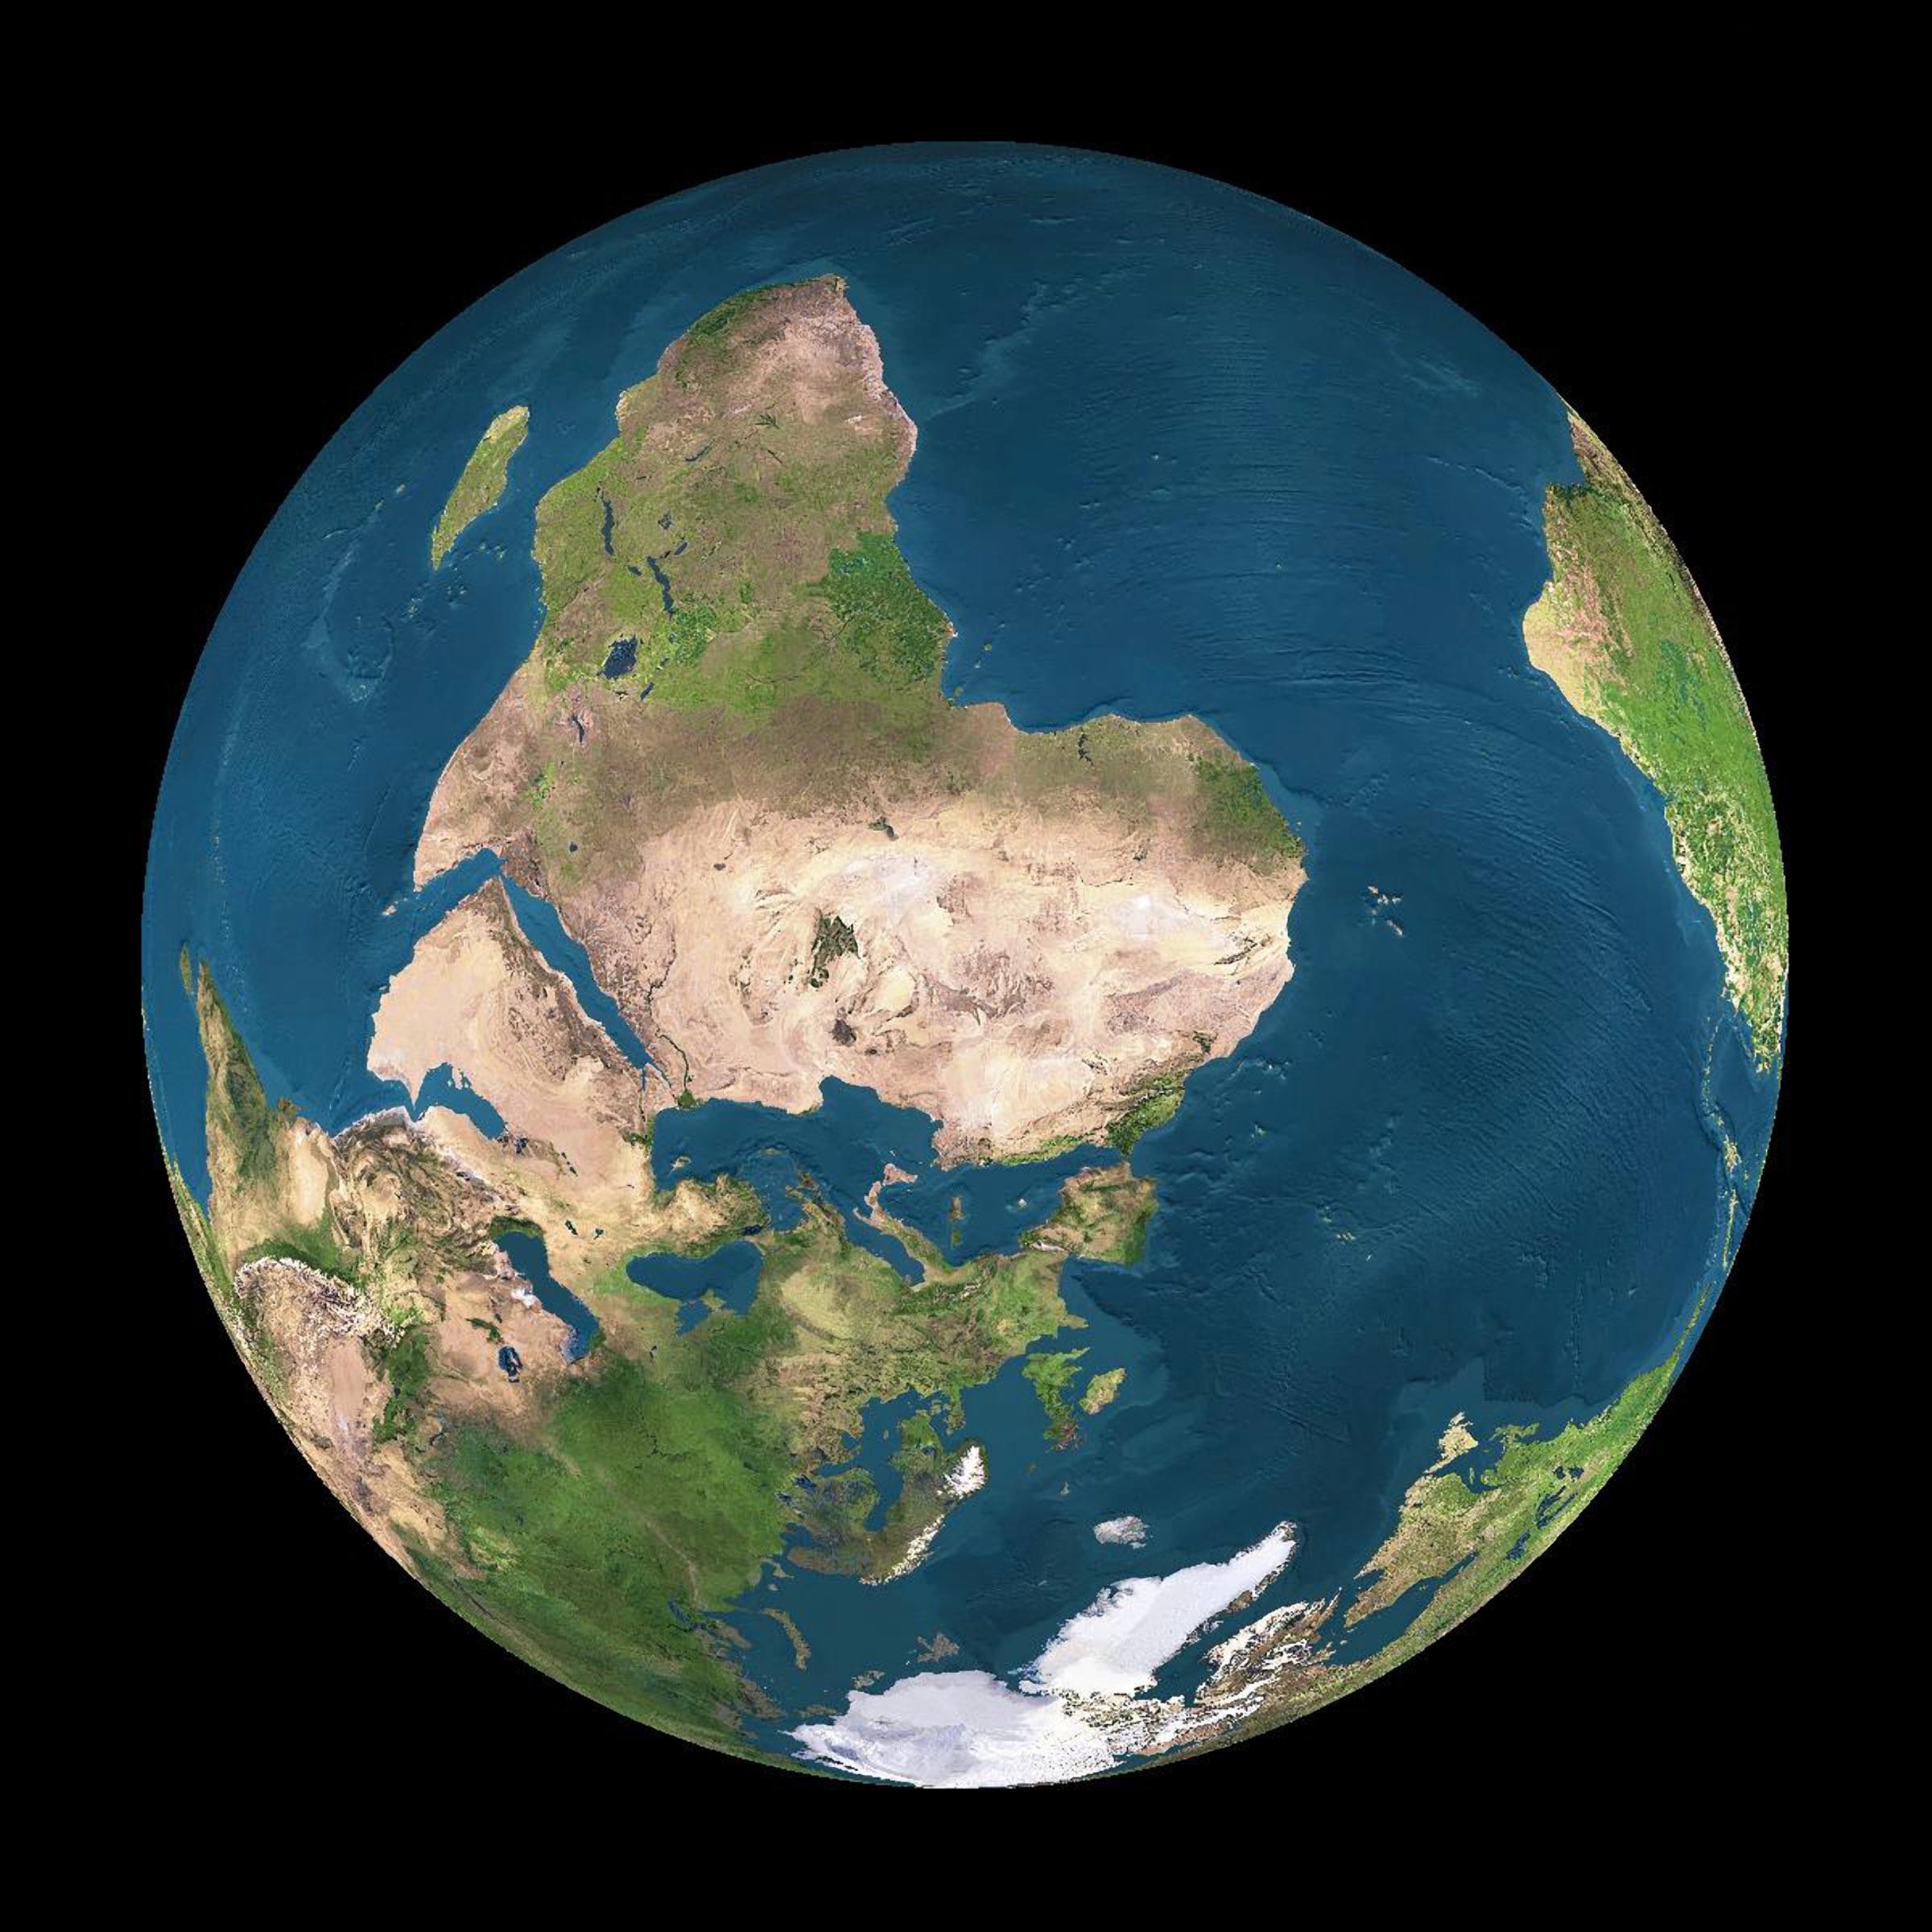
This globe would look “upside down” to Westerners in the 1900s, but “right side up” to Arabs and Persians in the 1100s. Even Google Earth, as “objective” as it looks, is Westernized.
Peters projection with south at top. Click to enlarge.
– Abagond, 2013.
Source: “A History of the World in Twelve Maps” (2012) by Jerry Brotton.
See also:


Reblogged this on oogenhand and commented:
Cartography was my major hobby during elementary school.
LikeLike
My parents gave me the Mercator projection map for my birthday, or was it Christmas). It was a political map as opposed to physical. It had almost all the nation’s flags displayed on the top and bottom edges. Antarctica was missing at the bottom of the world. Germany was divided, and the USSR and other European communist bloc countries still existed. And I got the map in 1996 if I recall.
LikeLike
Cool post! 😀
True about distortions being inevitable.
LOL!
^^As always, in probably any field.
I like that Arno Peters recognized the error of visualising the world euro-centrically. He might have made a mistake or 2, but he had vision about the way the world was drawn as colonized, and that any information about it is colonized as a result, too. He exposed that it was about ideology, not only geography.
It also goes to show demonstrate, most graphically, that what is presented to us as neutral, objective and authoritative are only cultural artefacts of white empire building. This is why I’ve sometimes thought of maps almost like a form of subliminal advertising — attitudes form without our even noticing.
LikeLike
There’s a rendering of Africa at this link that puts its REAL SIZE in perspective. relative to the sizes of supposedly other “large” land masses. The short video clip is noteworthy as well.
http://www.upworthy.com/we-have-been-mislead-by-an-erroneous-map-of-the-world-for-500-years?c=ufb2
What’s the likely 4th pillar of racism/white-supremacy???
Deception… which equates to Conventional Wisdom.
By any means necessary.
LikeLike
@Matari, 😀 You said it.
The European cartographers have drawn and re-drawn Africa since 1554.
Its dimensions and complexity has eluded them for 100s and 100s of years!
An article on the way Africa’s shape and size has changed (!) through the ages:
http://www.theguardian.com/news/datablog/gallery/2012/oct/02/africa-maps-history?CMP=twt_gu#/?picture=397029073&index=0
LikeLike
Also, note that blank spaces which they had not yet “discovered” on the continent..
Here be dragons..” and the like springs to mind.
LikeLike
I added a picture of an “upside down” globe at the end of the post. Of course it is not upside-down – it just looks that way through Westernized eyes.
LikeLike
@ Legion
Good idea. Thanks.
LikeLike
[…] "The Peters projection (1973), also called the Gall-Peters projection, is an equal-area projection, a way to show the round Earth as a rectangle while keeping all the areas that are equal on Earth equal on the map. It comes at the cost of making some continents and countries appear narrower than they are." […]
LikeLike
“The European cartographers have drawn and re-drawn Africa since 1554.
Its dimensions and complexity has eluded them for 100s and 100s of years!”
Yeah. They should have used the African’s maps. Oh, wait. Never mind.
LikeLike
Very weak effort Da Jokah. Definitely not up to your usual um…”standards”.
LikeLike
They did.
It was the Africans who gave the Europeans the information to draw better and better maps.
The Europeans just transcribed what the Africans showed and drew for them. After all, the Europeans were lost without local knowledge in unfamiliar terrain.
Though indirectly, those explorers admitted reliance on African knowledge.
Take Denham and Clappertons’ “Narrative of Travels and Discoveries in Northern and Central Africa, in the Years 1822, 1823, and 1824” (http://libweb5.princeton.edu/visual_materials/maps/websites/africa/denham/denham.html)
Or, William Desborough Cooley, who relied on African sources, but thought he knew better and was later proved wrong.
Ironic that the emphasis on visual representation is itself a Western bias…just because African cultures don’t have the same tradition as Europeans, that doesn’t mean they have nothing..
Not all cultures articulate space as “pictures”.
Because a culture doesn’t have “cartographers” in the European sense, is that the same as not possessing a sophisticated cognitive sense? Does it mean because someone convey layouts and boundaries using different methods than those used by Europeans, does it mean they lack some kind of spatial competence?
Africans were using stele, cosmo-graphic paintings or ceramics, and organizing their architecture along fractal lines long before Europeans even picked up a pen.
http://www.metmuseum.org/toah/hd/aksu_2/hd_aksu_2.htm
From my *reading about the subject, there is not even a standardized, definitive cross-cultural notion in existence of what a “map” is.
When the Europeans were first “exploring” the interior of the African continent, they were guided by people who knew where they were and where they were going. The Africans who navigated them through the continent had maps, and they were reliable enough and clearly useful enough to warrant white Europeans transcribing for general use.
(*Thomas J. Basset on “Indigenous Map-Making”)
LikeLike
When teaching school children the size of countries it should not be distorted.
LikeLike
The Mercator map was perceived as racist.
LikeLike
This is a very informative post, learned something new today.
LikeLike
So what I am learning about this topic that racial politics was involved in creating a map,”Wow”
LikeLike
@ Matari: That’s food for thought.
LikeLike
[…] "The Peters projection (1973), also called the Gall-Peters projection, is an equal-area projection, a way to show the round Earth as a rectangle while keeping all the areas that are equal on Earth equal on the map. It comes at the cost of making some continents and countries appear narrower than they are." […]
LikeLike
Excellent post Abagond!
And an excellent commentary and obsevation from Bulanik!
Most of us educated and culturally schooled in Western societies grow up believing and thinking what we’ve been told about the world is “universal” or “natural”. We never think to question this perspective as culturally created or given?
Its the #1 reason why most white commentators who come here objecting to the pleathro of posts Abagond produces commenting on the naunces of racsim (or white sumpriority, as I would call it) don’t “get it”. They REALLY believe their prescription of how we should view the world is the only one there is. So what is all this fuss about racism or ethnocentrism?
This in a nutshell is what Eurocentnism is all about…
And of course this doesn’t simply ONLY apply to white commentators. It applies equally to all of us raised or brought up in Western culturally dominant socieities. We can all be infected with this unnatural bias…
LikeLike
@ Kwamla, thank you for the kind comment.
LikeLike
The map which I enjoy looking at most is the Earth’s super-continent, Pangaea.
It was how the Earth looked many millions of years ago: one land mass and one ocean.
Although he wasn’t the first to see that South America “fit” into Africa and so on — that had been noticed 100 of years before — it was the German geophysicist Alfred Wegener, who popularized the idea of continental drift. How dynamic (unstable?) the planet is.
LikeLike
[…] "The Peters projection (1973), also called the Gall-Peters projection, is an equal-area projection, a way to show the round Earth as a rectangle while keeping all the areas that are equal on Earth equal on the map. It comes at the cost of making some continents and countries appear narrower than they are." […]
LikeLike
[…] See on abagond.wordpress.com […]
LikeLike
@ Legion
Shape distortions are understandable on flat maps, but size distortions are simply unnecessary. Greenland, which is much smaller than Algeria in reality, should never be portrayed as being as large as the whole continent of Africa as it is on most maps. That’s just ludicrous and indoctrinates people to think the African continent is much smaller than it really is and the European subcontinent is much larger than it is.
LikeLike
Reblogged this on Consult your Life.
LikeLike
[…] Peters projection […]
LikeLike
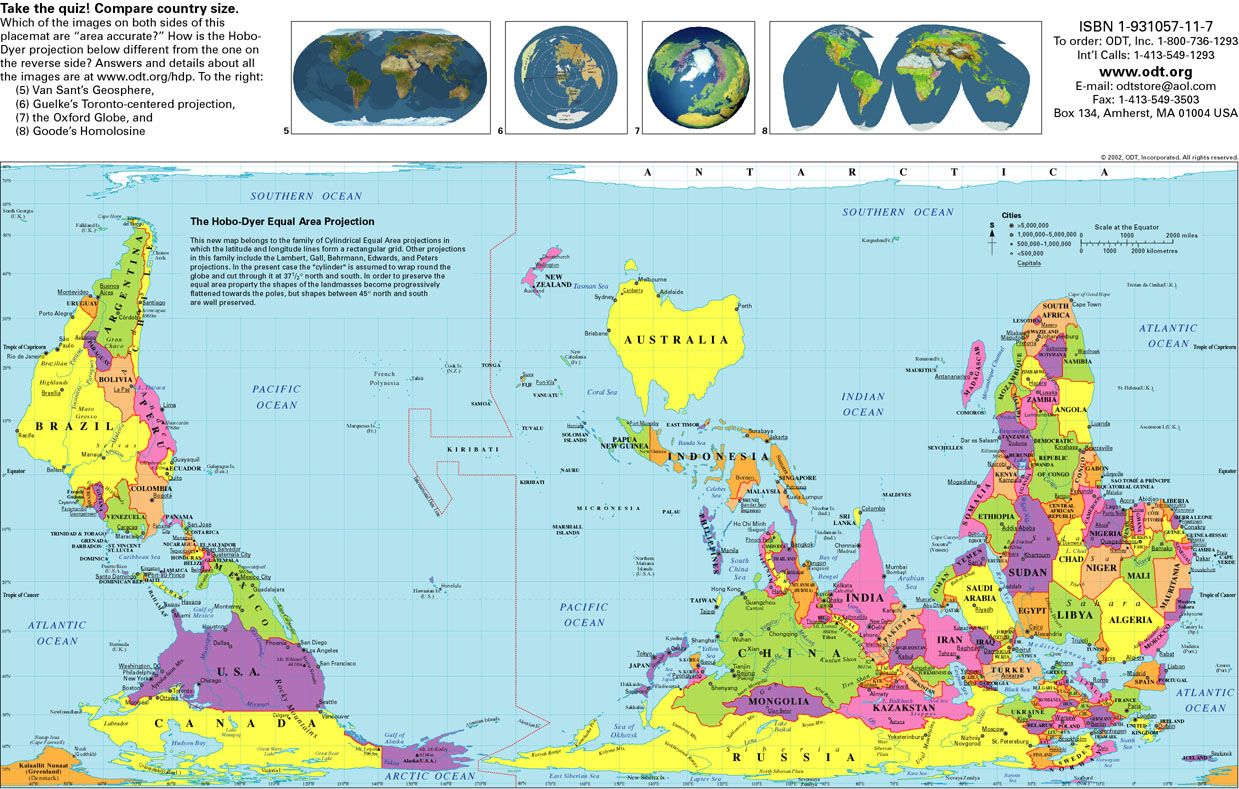
So remember: maps have a frame of reference; they “represent” (no more, no less) and we need to check the “fit”, match or fidelity. So, let’s go back once more to Figure 13. The team of President Carter did not select the controversial Peters Projection (people argued Africa’s shape was too stretched to fit the common grid used for atlases) but instead identified a “compromise” with less shape distortion around the equator: Something like a “staunched” Peters Map called “Hobo-Dyer” Map. The Hobo-Dyer Map is close to the Peters / Gall Projection which were independently created, one as a projection, the other as a mathematical transformation. When we take the Hobo-Dyer Equal Area Map and the Peters Map, the result is still “equal area” – (because “squeezing” or transformation still keeps the proportions).
LikeLike
“Peters and Robinson each thought his own map was the most accurate, the most objective.”
They’re not so strictly equivalent. The Robinson projection is much more accurate and useful than the Gall-Peters as world map. As you noted, any map projection is distorting some aspect of either shape, area or distance, especially if it’s a map of the entire world. Mercator distorts size and shape to maintain true distance for navigation. The Gall-Peters projection has true size at the cost of shape and distance. The Robinson is a compromise projection. It tries to minimize distortions in size, shape and distance, but at the cost of it not being totally true to any single aspect. The Robinson is much better as a wall map of the world, which is what it was intended to be, because it is a more accurate representation overall. The reason why Peters is so despised by cartographers is not because of his outsider status, but because he was misrepresenting map projections.
“This globe would look “upside down” to Westerners in the 1900s, but “right side up” to Arabs and Persians in the 1100s. Even Google Earth, as “objective” as it looks, is Westernized.”
It’s not really true to say this is specifically a Western thing. In medieval European maps, east was usually up, copying the more advanced Islamic maps, which mostly used either east or south. The Chinese used north as up first, because they had invented the compass, and it made sense to orient the map to the nearest magnetic pole. When Europeans developed the compass, and mapmaking shifted towards maritime navigation, north became up for the same reason as the Chinese, because the north magnetic pole was closer.
One way our another there has to be a standard as to which way will be the top of the map, and really it’s only a choice between north or south. As the dominant imperial powers, the European choice of north was the one that was imposed as the standard, although the majority of people, countries and landmass are closer to the north pole than the south also. A better example of imperialism and map standards is the location of the Greenwich Meridian. Unlike the equator or the poles, the meridian could have been located literally anywhere in the world, because longitude is entirely relative to the meridian. London was chosen because it was the heart of the most powerful empire of the time.
But the worst thing of the Gall-Peters debate, which way is “up” and other standards, is that they are distractions from the much more political issues of maps, namely what’s on them. Things like borders, place names, the unequal amounts of detail some places get over others, even accounting for population distribution, etc, etc. A map of Israel that erases the Palestinian territories is a much bigger deal than its orientation or projection, the altering of which would make literally no difference in the political content of the map.
LikeLike
Why haven’t they been able to make a true map? This whole thing sounds incredibly stupid. We’ve managed to put 12 persons on another celestial body but we can’t draw a fucking accurate map of our own planet? What is so difficult at just drawing the continents the way wee see them from space? If i wrap a piece of gingerbread-dough (or something similar) around a soccer ball, and then wrap it out on a flat surface, it’s still going to have the same surface area (provided that I don’t stretch/shrink it) . We know the distances between each continent/land-mass, why don’t they just draw them to scale?
LikeLike
[…] Note. The most important aspect of politics in maps to recognise and consider, is the hidden politics of fiction in maps that are not representative of the physical world -Peters projectionhttps://abagond.wordpress.com/2013/11/04/peters-projection/ […]
LikeLike