Here is how each county voted in the 2016 election for US president. The bluer a county, the more heavily it went for Democrat Hillary Clinton. The redder the county, the more it went for Republican Donald Trump (click to enlarge on all maps):
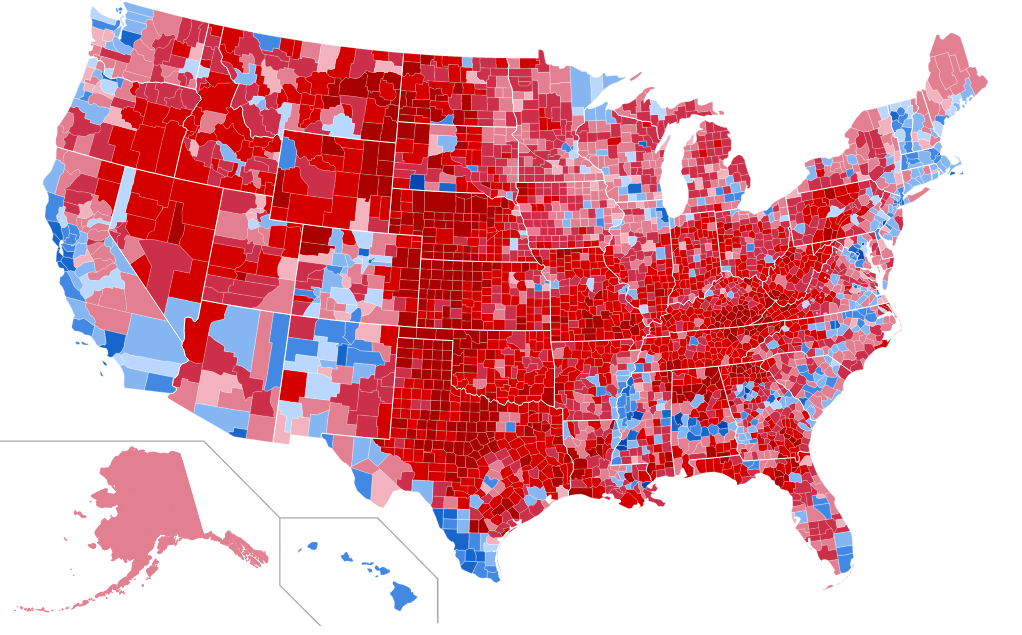
Note that Alaska is not divided by county. And maybe not Hawaii either..
The great thing about the county map is that you can compare it to other county maps, like those shaded for race, education, unemployment, etc, giving you some idea of what accounts for the voting pattern.
Race: (non-Hispanic) Whites by county in 2011 (darker red counties have a higher proportion of Whites):

Beyond the northern third of the country (New England, the Upper Midwest and the Northwest), it seems that Whites went heavily for Trump.
Blacks by county in 2010:

Latinos in 2010:

Natives in 2010:

Asians in 2014:

Immigration: If there is a rough match with race, there might be an even better one with immigration, particularly since it is an issue that Trump ran on. But new immigration, at least at the county level, seemed to have had no clear effect:

Unemployment: this seemed to have had no clear effect either, at least not at the county level:
You can see the Black belt, which went for Clinton, but you can also see the hard hit counties of Appalachia, which went for Trump.
Education: Many of the White counties that went for Clinton have a higher proportion of people with university degrees. It helps to account for, say, the suburbs of Philadelphia, the coast of Maine and that strange blue county in the middle of Tennessee.

Poverty: Trump does well in poor White counties, Clinton in poor Black, Latino and Native counties:

Religion: Here are the county maps for Evangelical Protestants and Catholics, the two largest religions:

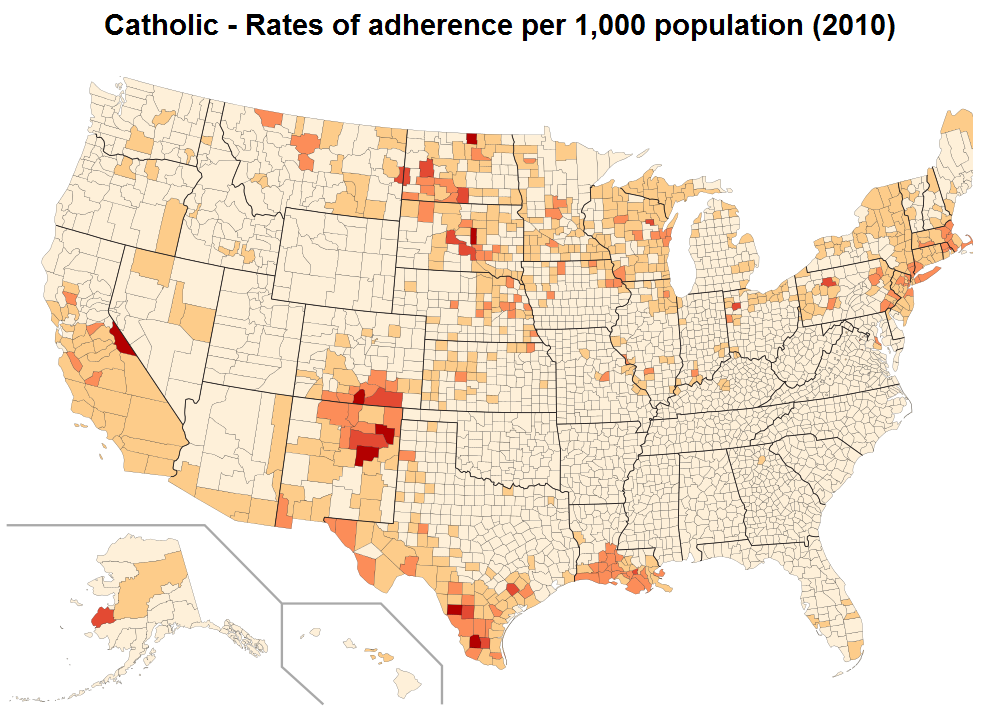
Clinton did well in some Catholic regions but not others.
Trump won 81% of White Evangelical Protestants. Going by these maps, that seems to be a nice way of saying “White Southerners”. While Evangelicals drop off north of the Kentucky border in Ohio and West Virginia, Trump’s support does not.
Regions: using Colin Woodard’s Eleven Nations of North America:

If you look at the election map (repeated below) you can see the rough outlines of Yankeedom and the Deep South, but not the Far West.
Here, by the way, is the 2012 map (Obama blue, Romney red. Notice how it is less polarized – more light blues and light reds):
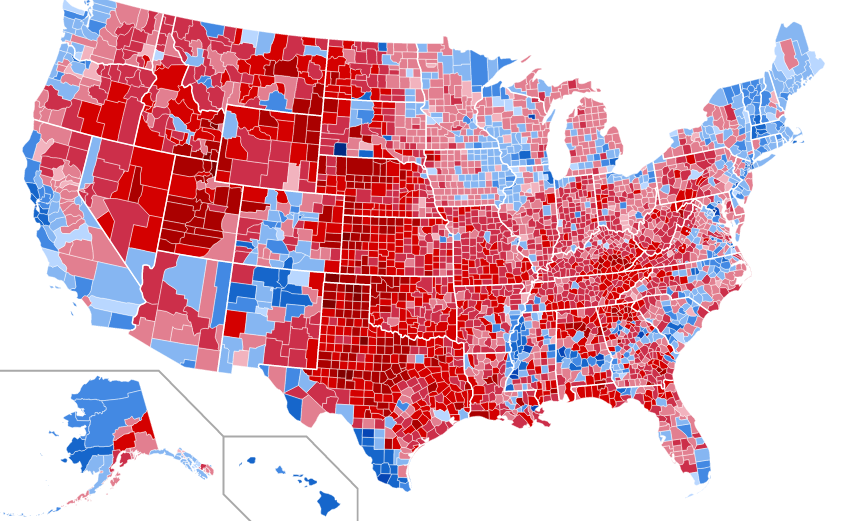
Trump did well in Greater Appalachia and the Midlands, poorly in El Norte, the Left Coast and New Netherland, and middling in the Deep South, the Far West and Yankeedom.
Conclusion: Race seems to be the strongest factor, education second, region third. Stuff like religion, unemployment, poverty and immigration seem to have had little effect, at least at the county level.
From these maps you would expect Trump to do best among Whites, particularly those without a university degree, but not because of religion, hard times or immigrants currently pouring into their counties.
– Abagond, 2016.
Update (November 16th): Here is the population density map. Some of Clinton’s wins are big cities, some not:

See also:


Your racism argument would have been stronger if you had compared these maps to the maps for 2008 and 2012. What was different this time? You keep flogging a dead horse, only an idiot would deny that racism played a role in Trump’s election. What role did removing minority voters from lists of eligible voters play?
LikeLike
I think there is an urban/rural factor also.
LikeLike
what do you call the line of blue that runs from maine to kansas city
LikeLike
what is that rts 95 and 10 more or less
LikeLike
This is the only map you need to understand America

LikeLiked by 2 people
I added a population density map for comparison.
LikeLike
Yes race was a factor in this election. When has it not been.?
Big factor this go round, no doubt about it. But as I have said before, both candidates were racist. Inyourface vs. stabyouintheback. At least as important in the decision though was that one candidate was incompetent sick reckless and criminal. And planning war with Russia. That certainly influenced my decision, as it must have influenced others, black or white Hispanic whatever. I also think she’s criminally insane. And Obama said she didn’t work hard enough to win votes.
The following is rumor. So take it with the proverbial grain of salt. From what I know about Hillary, it’s quite plausible. If something similar was floating around about Donald Trump, you can bet our biased media would be reporting it as fact. Hillary is our kind of racist. Trump is not.
(https://youtu.be/sGe_6BmCZo0)
LikeLike
video in mod/ meant to set to start 4:28
LikeLike
The “strange blue county in the middle of Tennessee” is Nashville, location of Vanderbilt University, Tennessee State University, and several smaller colleges. That’s why it went for Hillary and why the proportion of college educated people is so high.
LikeLike
right where the damn time zone is
LikeLike
I like ThatDeborahGirl’s map the best it pretty much describes why the orange orangutan is president elect and the dumb azzes who put him there.
LikeLike
@ThatDeborahGirl
I’ll wager there are higher levels of gun ownership in DFstan. That makes them exceedingly dangerous.
LikeLiked by 1 person
@ tankermottind
Yeah, I noticed some other tiny blue spots in seas of red that are counties with Research Intensive I universities.
LikeLike
@ Lord of Mirkwood
Teton County in north-western Wyoming has a high proportion of people with a university degree, maybe because of the parks and forests there (Yellowstone, Grand Teton, etc).
LikeLiked by 1 person
bet drive a 4×4 with at least three ply tires!!
LikeLiked by 1 person
it’s seems like it could be very unforgiving in the winter time, in wyoming
LikeLike
What’s this? Another pundit who thought Hillary was leading us to “nuclear annihilation? That certainly had to have given a lot of people pause, black white hispanic or whatever. A black guy saying it this time.
“With so many people who call themselves liberals and leftists tearing their hair out in dread of a President Donald Trump, it is necessary to point out that the prospects of avoiding nuclear war are much better than they were the day before the election. Hillary Clinton was committed to imposing a “no fly zone” over Syria that would have meant instant war with Russia, likely resulting in the annihilation of the human species. You’d think that would have made Clinton anathema to decent people. But Americans, including those who call themselves liberals, are not decent people – not really. Based on their political behavior, they just pretend to be decent, but support U.S. governments that have slaughtered millions since the end of World War Two. If you voted for Obama and Clinton, you gave your assent to continuing George Bush’s wars, allowing Obama to start two major wars of his own, in Libya and Syria, and to Hillary Clinton’s plans to roll the nuclear dice on the fate of humanity. The whole world knows that Americans are dangerous, to themselves and to others. But, decent? Since when, and to whom?”
applies to even black Americans, believe it or not
http://www.blackagendareport.com/war_less_imminent_since_election
LikeLike
casper, wy gave me a bad vibe, it was not colorado there, or: the only things to do up there are drink and drive
LikeLike
LikeLike
@Nomad.
Trump’s choice of Bolton, whose is a pro war neocon, makes his administration tilt towards conflict.
You have Rand on the right and a few Democrats on the left that are strong skeptics on war and regime change. The majority of Democrats and Republicans have no problem supporting American agression.
LikeLike
I was in Jackson Hole, Wyoming this summer. It’s a rich, touristy place. If there was a blue dot it would be there.
LikeLike
michaeljonbarker
Agreed. Trump just postpones the unthinkable. With Hillary we were on threshold. I think that’s basically what Ford says. But his appointments do look pretty awful. But hey. he is what he is. Kawasombie Kong.!
LikeLike
But already we’re seeing the difference. Obama is now agreeing to fight a real war against the terrorists he funded and empowered. Instead of the pretend one that was costing needless death and suffering and emigration. Russia has already launched a major offensive against the terrorists with no resistance from Obama. Trump looks like he is going to let Russia destroy Isis.
LikeLike
i drove from denver to crested butte co just as the monarch pass closed due to snow, and then, somehow i got to casper driving, i was stayin out in denver for about a month that time, it was winter and cold just a couple bars and a bunch of pickup trucks in wyoming
LikeLike
Massachusetts and Vermont were the only states where no counties went to Trump. It’s not surprising that two of the nation’s strongest progressives – Elizabeth Warren and Bernie Sanders – are from Massachusetts and Vermont, respectively (Warren-Sanders 2020, anyone?) Massachusetts didn’t even have any light blue counties like Vermont did (only medium and dark blue ones). My county (in Massachusetts) was dark blue. I love living in the Greater Boston area. Besides a lot of progressives, we apparently also have a lot of degrees, a lot of migrants, and a fairly large amount of Catholics. Interesting maps!
LikeLiked by 3 people
i love that so many of the counties actually bordering Mexico went blue. . .
LikeLike
@Paige
” I love living in the Greater Boston area. Besides a lot of progressives, we apparently also have a lot of degrees, a lot of migrants, and a fairly large amount of Catholics.”
And home to a lot of open racists. Almost every black person I know who’s ever spent significant time in that hell hole says it’s one of the most racist places they’ve ever been.
And just because you voted Democrat does not mean you’re any less racist than those who voted Republican. They are two sides of the same coin of “white supremacy”.
LikeLiked by 2 people
Nomad and Fan will enjoy this.
(https://www.youtube.com/shared?ci=-mqYYUwXagw)
LikeLiked by 1 person
@abagond,
The alt-right found another way to misinterpret the maps. I am now convinced that white Americans only believe news that confirms their bias, regardless of the truth.
https://www.washingtonpost.com/news/the-fix/wp/2016/11/15/thanks-to-a-bad-map-and-bizarre-math-breitbart-can-report-that-trump-won-the-real-popular-vote/
LikeLiked by 1 person
@ Lord of Milkwood
Re. “New England” & Trump.
On 11 Nov. members of a Wilton Connecticut football team chanted “Build the Wall” at a game in Danbury. Danbury is a city in CT w/ more POC than Wilton — which is a small town & predominantly White. Wilton is about an hour north of NYC in Fairfield County which is predominantly Democrat. Trump is like a virus.
LikeLiked by 1 person
@resw
“And home to a lot of open racists. Almost every black person I know who’s ever spent significant time in that hell hole says it’s one of the most racist places they’ve ever been.”
in grad school in the deep south I had a colleague from boston. I was surprised to find he was one of the most racist people I’d ever met. he fit right in.
LikeLiked by 1 person
This video, at the end of it, makes at least one good point… repression is certainly coming whether we’re ready for it or not.
News Flash: Repression isn’t coming. It’s been here since 9/11!
Under Trump, further repression LOOMS obviously. Public opinion thinks HC is less repressive than Trump, (I disagree…probably why she had to cheat in order to beat Bernie).
Had Dr. Ben Carson managed to hold his early lead in the Republican primaries, and won the republican party nomination, he would have towed the establishment line (for further repression) as any of the runners would have had they won.
My point is that these repressive laws that have passed since 911 wouldn’t have repealed under Bernie or any of the establishment approved cast of characters paraded in front of the people as a choice for POTUS. If any of the above had won, it’d just be more of the same.
LikeLiked by 2 people
^^^^^^
My last comment was for michaeljonbarker
LikeLike
@nomad
That’s not surprising. Many people from the North, especially New England, like to pretend things are so much better, when the evidence all suggests otherwise. And they premise that nonsense on the fact that they vote Democrat more than Republican, as if Democrats can’t be racist (lord of mirkwood is a perfect example of such a racist).
The top 5 most segregated cities identified by the US Census are ALL IN THE NORTH. And no surprise Boston is #9 on the list.
LikeLike
“That’s not surprising.” when you first encounter it it is. that was in my younger naïve days
LikeLike
Maybe some more analysis of the nonvoters would be informative too.
https://www.washingtonpost.com/news/the-fix/wp/2016/11/16/a-lot-of-non-voters-are-mad-at-the-election-results-if-only-there-was-something-they-could-have-done/
LikeLike
@jefe
That was an interesting article. Thanks for the link.
LikeLike
Oglala Lakota County, the darkest blue county in South Dakota, was 94% Native and 5% White in 2000. It is where the Pine Ridge reservation is, where the Wounded Knee massacre took place. Trump got only 8% of the vote.
LikeLike
That blue county on the southern border of North Dakota is where the Standing Rock reservation is, where the #NoDAPL protests are taking place. Trump has at least $500,000 to $1,000,000 invested in the pipeline company.
LikeLike
And home to a lot of open racists. Almost every black person I know who’s ever spent significant time in that hell hole says it’s one of the most racist places they’ve ever been.
LOLZ!
And just because you voted Democrat does not mean you’re any less racist than those who voted Republican. They are two sides of the same coin of “white supremacy”.
Exactly.
in grad school in the deep south I had a colleague from boston. I was surprised to find he was one of the most racist people I’d ever met. he fit right in.
No surprise there.
News Flash: Repression isn’t coming. It’s been here since 9/11!
Repression for whites! We already experience it every day in some form or another. Perversely, we are probably better prepared.
LikeLiked by 1 person
That Boston is where they had that bus desegregation. Things probably haven’t changed much.
LikeLiked by 1 person
I have lived almost my whole life in the blue Clinton counties.
LikeLike
Further attesting to the open racism in the Boston area, and Massachusetts generally, the SPLC said the state had 42 reported hate crimes since the election. And no they were not mostly anti-Trump hate crimes, but anti-black, brown and Muslim.
Several states with larger populations (Virginia, North Carolina, Georgia, Pennsylvania and Florida) all had LOWER reported incidents of hate crimes.
Blue state or nah, it’s just as racist if not more than red states.
LikeLiked by 1 person
Aljazeera and Chomsky’s take.
Some analysis @14:00-16:00
LikeLike
Sorry, forgot the Youtube link
Noam Chomsky on the new Trump era – UpFront special
(https://youtu.be/jB54XxbgI0E)
LikeLiked by 2 people
@Herneith
“Repression for whites! We already experience it every day in some form or another. Perversely, we are probably better prepared.”—Exactly. Which is why after this election many of my white friends had a complete meltdown. Secretly I got a giggle listening to them talk of how they will go on, while thinking “the same d*mn way blacks did.
LikeLike
Of the IP addresses of the last 20 commenters on this blog, 11 could be narrowed down to a particular US county. Of the 11 counties, only one was red! Two more could be narrowed down to a particular US state. Both of those states were blue. Seven IP addresses come from outside the US.
So it seems that over 90% of the US commentariat on this blog comes from the blue parts of the nation. About 70% come from in or near the string of blue counties that run from Maine to Memphis.
LikeLike
@Abagond
Some time ago you posted a global heat map that showed where many of your blog’s commenters were located.
Have you updated that map recently?
LikeLiked by 1 person
@ Sharina
“… listening to them talk of how they will go on, while thinking “the same d*mn way blacks did.”
.
I doubt they’ll have similar coping skills to that which Black people possess. Instead look for and expect to see spikes in their suicide rates, more violence (against Blacks and others) and greater submission to disease.
Like Herneith says, we are better prepared [if only because we’ve had centuries of practice].
LikeLiked by 1 person
I might like to see a heat map of the commenters too, say the top 100 commenters on this blog, and make a dot for each of them.
LikeLiked by 2 people
@jefe
Now that would be interesting.
LikeLiked by 1 person
This post is the only one I found in the blog which has a map of race by county.
This one shows one dot per person at the census tract level. This give a much better depiction of the segregation across the whole country.
The Racial Dot Map: One Dot Per Person for the Entire U.S.
https://demographics.virginia.edu/DotMap/index.html
LikeLike
This map may be a better representation on how the USA voted graphically, with a figure for each 250,000 people.
LikeLike
@ jefe
Wow. That map destroys the whole idea of red states and blue states.
LikeLike
What it shows me is what I suspected all along.
Blue and Red are found in all states.
Blue is found mostly in larger urban areas and in white minority areas (rural or urban, with the exception of Vermont), and also in a couple of the large college towns (Austin, Charlottesville).
Red is found in majority white regions outside the large urban areas and outside Vermont.
However, each of the large urban areas typically include a red suburban section that is majority white where they tend to congregate (eg, Staten Island, Virginia Beach, etc.),
LikeLike